I thank Drs Brown and Cotton for taking the time to explore our data and we take this opportunity to respond to the comments made regarding our statistical models.
I would like to start by saying that I am concerned by the lack of transparency on the side of Drs Brown and Cotton. The comment states that the residuals are overdispersed and that their models provide a “superior fit” without providing any evidence of such statements despite the particular ease of doing so. This is particularly disconcerting given their statement that they “still believe that society is better served by good scientific analysis”, which is not demonstrated here since they neither provide the code nor the parameters for their analyses. This is in contrast to us that have been completely open by consistently providing code and data.
Thus, to determine the validity of their statements, we first performed the analyses they suggest and explore these analyses to determine whether their conclusion that a negative binomial model is necessary is correct. We provide the code and plots associated with each of the analyses below to demonstrate our transparency in our exploration of the data.
To first examine their statement, we explored the residuals in our models and the models associated with the data and provide the plots demonstrating the distribution of the residuals.
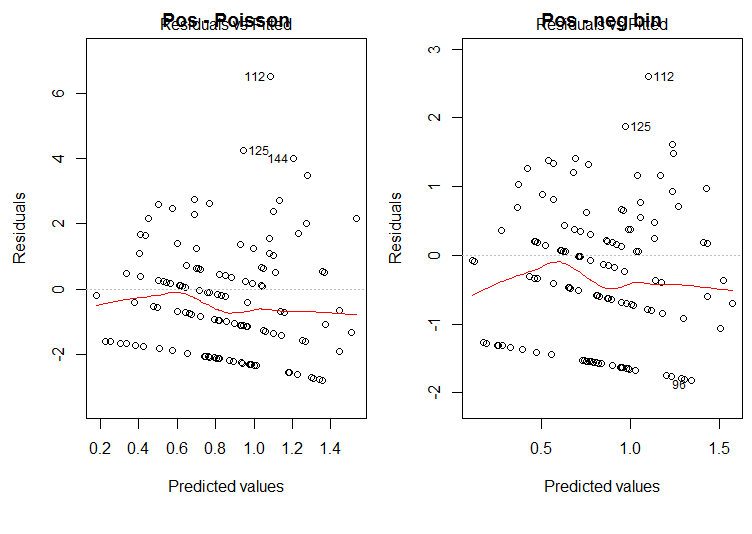
As can be seen above, the distribution of the residuals look very similar and there is no evidence for dispersion in our model (left) compared to the negative binomial model (right). Additionally, when examining the theta value for the negative binomial analysis (modelAGGPos.nb in our R code), the theta is 1.108 which provides no support to the conclusion that a negative binomial model is necessary.
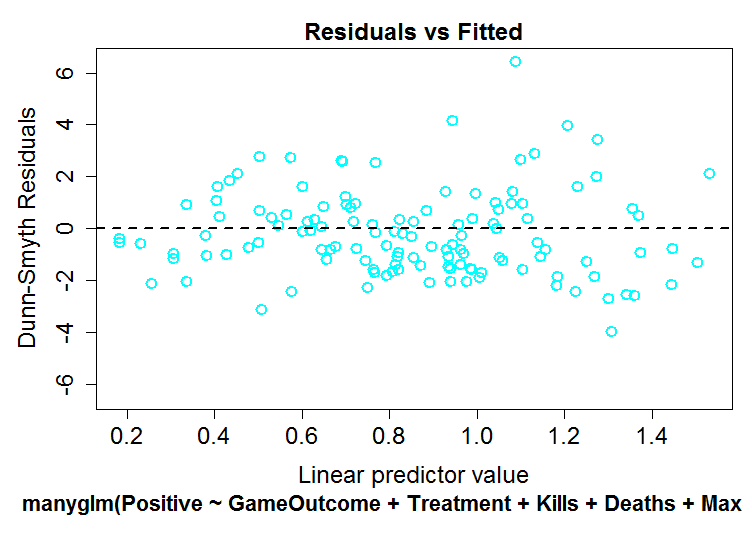
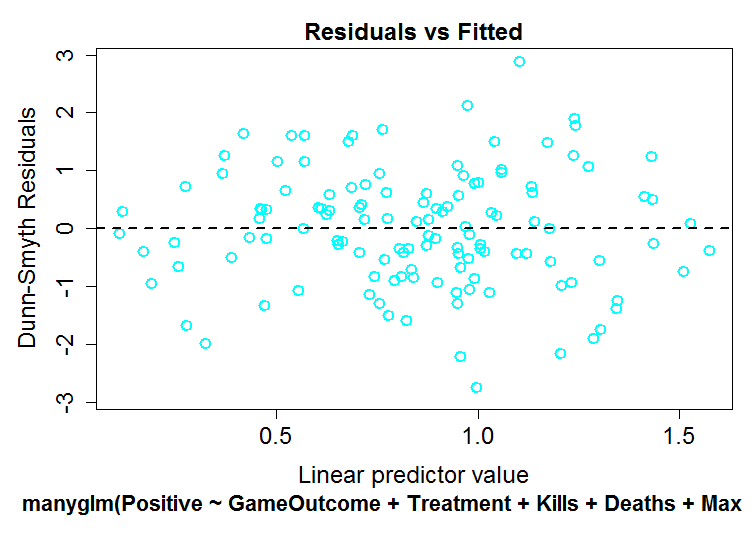
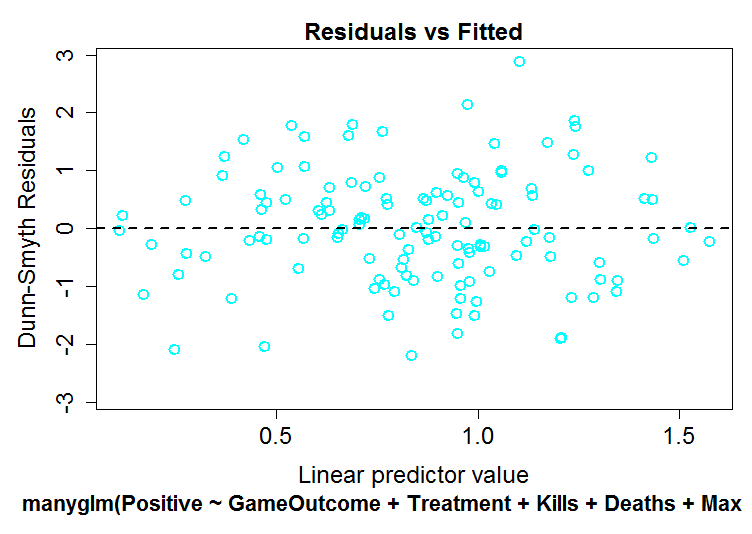
Because we are not clear of the methodology used by Drs Brown and Cotton, we explored the data further by estimating theta in two different ways and exploring the data using Dunn-Smyth residuals to provide a more accurate examination of the residuals and their dispersion.
As can be seen below, the distributions of the residuals of our model (top) do not visually differ from the two negative binomial models determined by two different theta estimation techniques (middle: phi, bottom: maximum liklihood). Again, there is absolutely no evidence for overdispersion of our data.
Based on the analyses above, I conclude that there is no a priori reason to use a more complex model that fits extra parameters simply because “poisson models are particularly susceptible to problems with overdispersion”. Although this may be true in some data, there is no such evidence of overdispersion in our data, and as a result, no need to use a negative binomial model simply to make analyses more complex.
The analyses that we provide thus support the statistics used in our study, and therefore, our conclusions.
Without proper support for the use of a particular statistical technique, it seems that post hoc suggestions of analytical changes are suggested in an attempt to discredit our study. Although science benefits from discussion, it also benefits from complete openness, something that we have demonstrated from the beginning.
Second Response
I see that my above response was unsatisfactory, and I am now of the mind that this is becoming a little bit of a statistical “witch hunt” as it is progressing past acceptable statistical analyses and into the realm of “my statistics are better”.
Before responding to the above comment, I initially want to state that there is no one statistical technique that is best. These two posts here discuss this topic well and I suggest that any reading these comments have a look because they discuss the strengths and weaknesses of statistics and also the way that scientists go about thinking about and using statistics.
- https://cesess.wordpress.com/2015/08/03/on-the-appropriate-use-of-statistics-in-ecology-an-interview-with-ben-bolker/
- http://fivethirtyeight.com/features/science-isnt-broken/
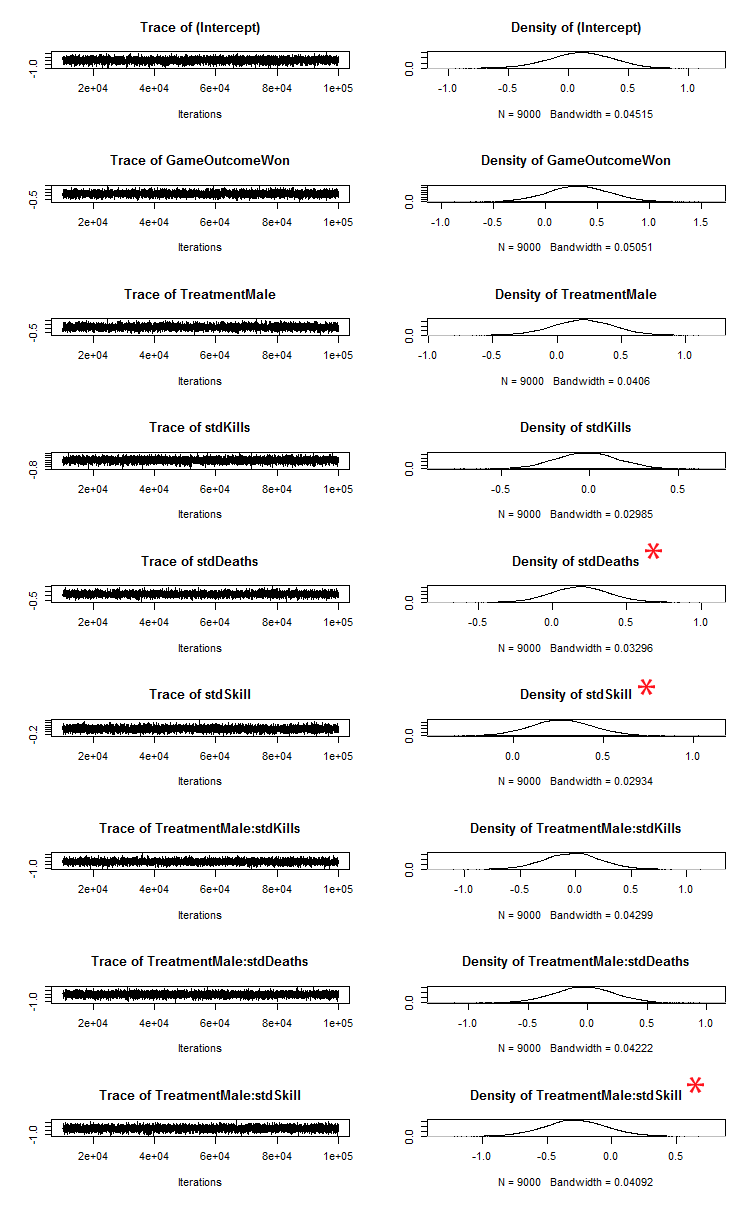
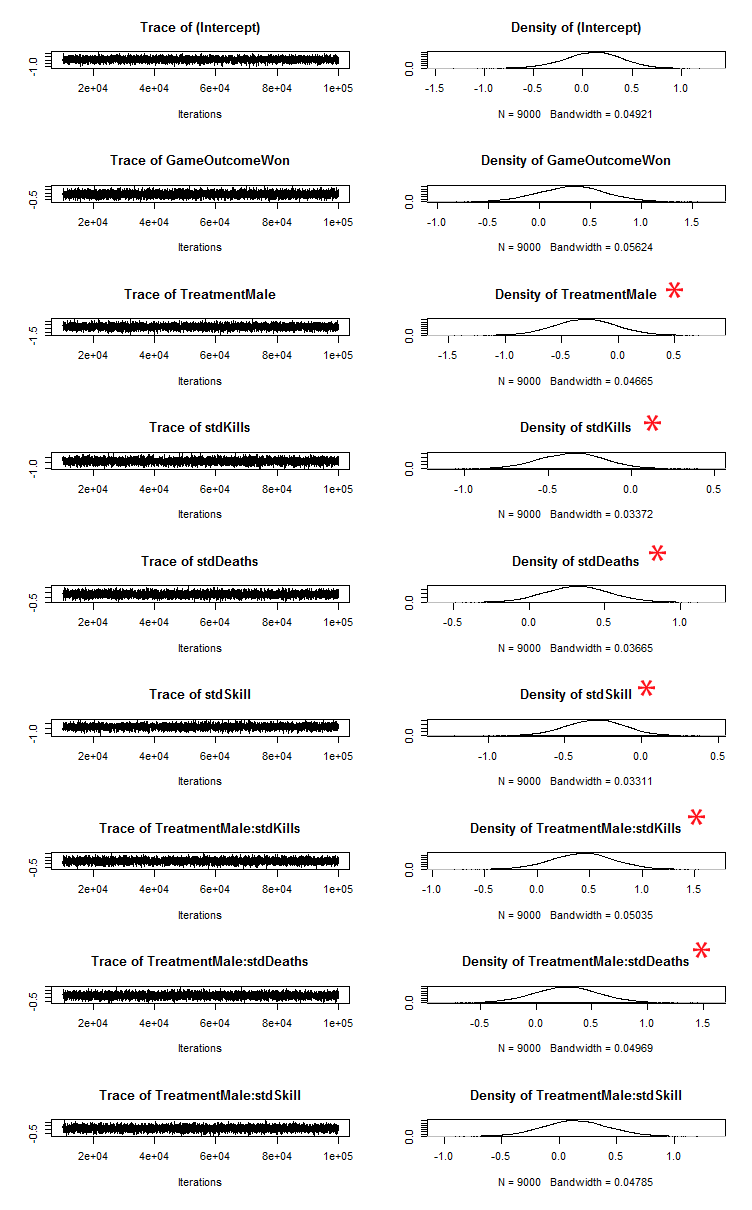
To respond to the comment, rather than argue about which technique is “more correct” (and yes, I noticed that you had to put you credentials on the bottom in order to highlight your apparent superior qualifications in this matter), I am going to use a Bayesian approach so that we don’t get bogged down in searching for p-values and assumptions over distributions and over-dispersion.
The figures can once again be found here (http://www.michaelkasumovic.com/response-to-plos-one-statistical-comment/) and the code can be found amended to the original code.
Rather than searching for p-values, this approach provides us with an estimate of how likely our individual factors are to have an effect. From looking at the plots of the analyses, we see that the posterior distribution is much further from 0 in the factors that were originally significant (denoted by the red asterisks in the figure).
This secondary approach thus provides similar results to our initial approach. Interestingly, in this Bayesian approach, there is evidence that the outcome of the game also has interesting effects on behaviour, something our initial model did not demonstrate. and something to explore further.
Positive Comments
Negative Comments
 I hope that this now demonstrates two things:
1) the robust nature of our data, and
2) the fact that there is no ‘one best’ statistical methods to analyze data.
How data are analyzed are dependent on assumptions, individual perceptions, and experiences dealing with different types of data. Arguing over the best approach and the extent to which our over-dispersion is a problem are not really progressing science. If you don’t “believe” our results, no problem, go ahead and replicate our experiment.
Effort into replication would be much better served as we need more data examining these ideas and theories. In fact, I encourage others to explore these ideas further as we are doing the same. Hopefully, after many studies, we can come to a general consensus.
I will also say that we are not taking our results as gospel truth (no science should ever be). What we are saying is that we have interesting effects of several factors on male behaviour towards women. What our results suggests is that these factors need to be explored further. Arguing over statistical approaches is not going to change the fact that further studies need to be done to explore these ideas.
At this point, I will consider this matter closed and will not discuss the validity of our statistical models as I see no benefit to doing so as it seems you will simply attempt to discredit us using another statistical approach you find to be superior.
I hope many others find these comments and the discussion useful.